


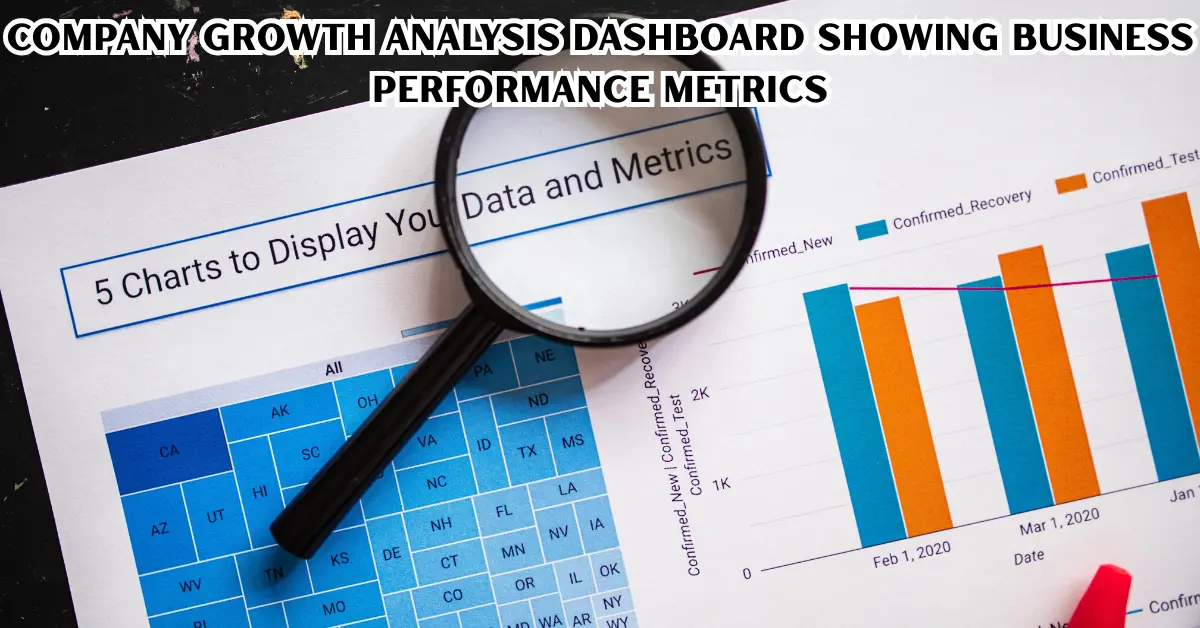
Company Growth Analysis is the process of evaluating how a business is expanding over time by examining revenue, customers, market position, profitability, operations, and other important performance indicators. It helps business owners, managers, investors, and analysts understand whether a company is growing, where that growth is coming from, and whether it can continue.
A useful company growth analysis goes beyond simply asking whether sales increased. A company can generate higher revenue while facing declining profit margins, rising customer acquisition costs, or increasing operational problems. For this reason, growth should be analyzed from several perspectives.
This guide explains what company growth analysis means, which metrics matter most, how to perform an analysis step by step, practical examples, benefits and limitations, common mistakes, and ways businesses can use their findings to make better decisions.
What Is Company Growth Analysis?
Company growth analysis is the systematic evaluation of a company’s growth over a specific period using financial, customer, operational, and market data. The purpose is to identify growth trends, understand their causes, and determine whether the business is developing sustainably.
Companies commonly compare performance across months, quarters, or years. Depending on the business, analysts may examine:
- Revenue growth
- Customer growth
- Sales volume
- Market share
- Profitability
- Employee growth
- Geographic expansion
- Product performance
- Customer retention
- Cash flow
- Operating efficiency
For example, if a company increased annual revenue from $2 million to $2.5 million, its revenue increased by 25%. However, that figure alone does not explain whether the business actually became healthier.
An analyst would also examine costs, profit margins, customer retention, cash flow, and the reasons behind the additional revenue.
Why Is Company Growth Analysis Important?

Company growth analysis helps turn raw business data into useful information. Instead of relying on assumptions, decision-makers can identify measurable trends and investigate what is driving them.
1. It Shows Business Performance
Growth analysis helps determine whether important business indicators are moving upward, downward, or remaining relatively stable.
A company might discover that revenue is increasing while customer numbers remain flat. That could indicate higher spending from existing customers rather than successful customer acquisition.
2. It Helps Identify Growth Drivers
Growth can come from different sources, including:
- New customers
- Existing customer purchases
- Higher prices
- New products
- New markets
- Acquisitions
- Increased sales productivity
Understanding the source of growth is important because different growth drivers have different risks and requirements.
3. It Supports Better Planning
Businesses can use growth analysis when setting budgets, hiring employees, launching products, expanding into new markets, or investing in marketing.
Historical performance does not guarantee future results, but it provides useful evidence for planning scenarios.
4. It Reveals Potential Problems
Growth analysis can uncover issues that headline revenue figures hide.
For example, revenue may rise while:
- Customer acquisition costs increase
- Gross margins decline
- Customer churn increases
- Operating expenses grow faster than sales
- Cash flow becomes weaker
These signals deserve further investigation.
Key Metrics Used in Company Growth Analysis
No single metric can fully explain company growth. A strong analysis combines multiple indicators.
Revenue Growth
Revenue growth measures how much a company’s sales have changed over a given period.
A basic revenue growth formula is:
Revenue Growth Rate = (Current Revenue − Previous Revenue) ÷ Previous Revenue × 100
For example, if revenue increased from $500,000 to $600,000:
($600,000 − $500,000) ÷ $500,000 × 100 = 20%
The company experienced 20% revenue growth during that period.
Profit Growth
Revenue growth does not automatically mean profit growth.
Businesses should examine operating profit, net profit, and relevant profit margins to understand whether additional sales are translating into stronger financial performance.
Customer Growth
Customer growth measures how the company’s customer base changes over time.
A business may track:
- New customers acquired
- Active customers
- Returning customers
- Lost customers
- Net customer growth
Customer growth is particularly useful for subscription, SaaS, retail, ecommerce, and service businesses.
Customer Retention and Churn
Retention measures how effectively a
keeps customers, while churn measures the rate at which customers leave.
A company experiencing rapid customer acquisition but equally rapid customer losses may have a different growth profile from a company steadily retaining customers.
Average Revenue Per Customer
Average revenue per customer helps determine how much revenue the business generates from its customer base.
A simplified calculation is:
Average Revenue Per Customer = Total Revenue ÷ Number of Customers
This metric can help explain whether growth comes from acquiring more customers, increasing customer spending, or both.
Market Share
Market share indicates the company’s portion of a defined market.
For example:
Company Market Share = Company Sales ÷ Total Market Sales × 100
Market share should always be calculated using a clearly defined market, geographic area, product category, and time period.
Employee Growth
Employee growth can provide context about organizational expansion.
However, hiring more employees is not automatically evidence of successful growth. Analysts should consider whether additional employees are supporting higher revenue, improving capacity, or creating unnecessary costs.
Cash Flow
Cash flow is an important part of growth analysis because profitable businesses can still experience financial pressure if cash is poorly managed.
Rapid expansion may require additional working capital for inventory, employees, equipment, marketing, or receivables.
How to Perform a Company Growth Analysis
A structured process makes company growth analysis easier and more reliable.
Step 1: Define the Analysis Period
Start by choosing the period you want to evaluate.
Common comparisons include:
- Month over month
- Quarter over quarter
- Year over year
- Three-year growth
- Five-year growth
The appropriate period depends on the company’s business model and available data.
Seasonal businesses should be careful when comparing periods with different seasonal characteristics.
Step 2: Collect Reliable Data
Gather information from relevant business sources, such as:
- Financial statements
- Accounting systems
- Sales reports
- Customer databases
- Website analytics
- CRM platforms
- Market research
- Industry reports
- Internal operational reports
Data quality matters. Inconsistent definitions can make comparisons misleading.
Step 3: Analyze Revenue Trends
Compare revenue across the selected periods.
Look for:
- Overall growth
- Declining periods
- Seasonal patterns
- Product-level changes
- Geographic differences
- Customer-segment performance
Do not stop at the final revenue number. Investigate why the change occurred.
Step 4: Examine Profitability
Compare revenue with costs and profitability.
Useful questions include:
- Did gross profit increase?
- Did operating expenses grow faster than revenue?
- Did profit margins change?
- Which products generate the strongest margins?
- Are new markets profitable?
This helps distinguish sales expansion from financially sustainable growth.
Step 5: Analyze Customer Performance
Study customer acquisition, retention, churn, and spending behavior.
For example, if customer numbers increased by 30% but retention declined, management should investigate why customers are leaving.
Step 6: Examine Products and Services
Break growth down by product or service.
One product might generate most of the company’s growth while another product is declining. Understanding this difference can influence future investment decisions.
Step 7: Evaluate Market and Competitive Factors
Company growth should also be considered within its market.
Research factors such as:
- Market size
- Demand trends
- Competitor activity
- Pricing changes
- Regulatory changes
- Consumer behavior
- Technological developments
- Geographic opportunities
Internal company performance can be affected by external conditions.
Step 8: Identify Growth Drivers and Risks
At this stage, separate positive growth drivers from potential risks.
For example:
Growth drivers
- Strong customer retention
- Successful product launches
- Expansion into new regions
- Increased sales productivity
Potential risks
- Rising acquisition costs
- Supplier dependence
- Falling margins
- High customer concentration
- Increasing competition
Step 9: Compare Results With Business Goals
Actual performance should be compared with the company’s objectives.
A company that grows 15% may consider that result differently depending on whether its target was 10%, 20%, or 30%.
Targets should therefore be considered alongside the company’s resources, market conditions, and strategic objectives.
Step 10: Create an Action Plan
The final stage is turning analysis into practical actions.
Possible actions may include:
- Improving customer retention
- Reducing unnecessary costs
- Investing in successful products
- Expanding sales channels
- Improving pricing
- Entering carefully selected markets
- Automating inefficient processes
- Strengthening customer support
Company Growth Analysis Example
Consider a fictional company called BrightTech Solutions.
Suppose its revenue changed from $1 million in Year 1 to $1.3 million in Year 2.
Its revenue growth is:
($1.3 million − $1 million) ÷ $1 million × 100 = 30%
At first glance, this looks like significant revenue expansion.
However, a deeper company growth analysis might show that:
- Customer numbers increased
- Marketing spending increased significantly
- Customer retention remained stable
- Operating costs increased
- Profit grew more slowly than revenue
The analysis therefore provides a more complete picture than the 30% revenue figure alone.
Management could then investigate whether the additional marketing investment is producing enough long-term customer value and whether operating costs can be controlled.
This example demonstrates why growth analysis should examine multiple indicators instead of relying on one headline metric.
Financial Growth vs Operational Growth
Company growth has several dimensions, and they do not always move together.
| Growth Area | What It Measures | Example Question |
| Revenue growth | Sales expansion | Are sales increasing? |
| Profit growth | Earnings expansion | Is the company becoming more profitable? |
| Customer growth | Customer-base expansion | Are more customers using the business? |
| Market growth | Competitive position | Is the company gaining market share? |
| Operational growth | Capacity and efficiency | Can the company serve more demand effectively? |
| Workforce growth | Organizational expansion | Is staffing keeping pace with business needs? |
Analyzing these areas together provides greater context.
Benefits of Company Growth Analysis
A well-structured analysis can support several business activities.
Better Resource Allocation
Management can identify areas that are producing results and areas that require improvement.
More Informed Investment Decisions
Growth trends can help businesses assess where additional resources may be needed, although decisions should also consider risk, available capital, and strategic objectives.
Stronger Performance Monitoring
Regular analysis makes it easier to identify changes before they become larger operational problems.
Improved Strategic Planning
Businesses can use historical and current data to develop different growth scenarios.
Better Understanding of Customers
Customer-level analysis can reveal changes in purchasing behavior, retention, and demand.
Limitations of Company Growth Analysis
Company growth analysis is useful, but it has limitations.
Historical Data Does Not Guarantee Future Performance
Past growth can provide context but cannot guarantee that the same trend will continue.
Data Quality Can Affect Conclusions
Incorrect, incomplete, or inconsistent data can produce misleading results.
External Conditions Can Change
Economic conditions, competitors, regulations, technology, and customer preferences can change quickly.
Growth Can Be Difficult to Compare
A small company and a large company may have very different growth rates even when their absolute revenue increases are very different.
Different Industries Require Different Metrics
The most useful metrics for a software company may not be the same as those for a manufacturing business, retailer, or professional services company.
Common Mistakes in Company Growth Analysis
Avoiding common mistakes can make the analysis more useful.
Focusing Only on Revenue
Revenue is important, but it does not provide a complete picture of financial health.
Ignoring Profit Margins
A business can increase sales while becoming less profitable.
Using Poor Comparisons
Comparing unusual seasonal periods can distort the apparent growth trend.
Ignoring Customer Retention
Acquiring customers without understanding retention can hide weaknesses in the customer experience.
Looking at Too Short a Period
One month or one quarter may not provide enough context for identifying a meaningful long-term trend.
Treating Correlation as Causation
Two business metrics can change at the same time without one necessarily causing the other.
For example, higher advertising spending and higher revenue may occur together, but additional analysis is needed before concluding that advertising alone caused the revenue increase.
Tips for More Effective Company Growth Analysis
Use a consistent methodology each time you conduct an analysis.
Keep metric definitions consistent across reporting periods and document where the data comes from.
Segment results by product, customer type, geography, or sales channel when those differences matter.
Combine financial metrics with operational and customer metrics.
Use charts and dashboards to identify trends quickly, but investigate the underlying data before making conclusions.
Most importantly, connect every major finding to a business question. Instead of simply saying that revenue increased, ask what caused the increase, whether the increase was profitable, and whether it can reasonably be sustained.
Effective company growth analysis helps businesses understand revenue trends, customer growth, profitability, market position, and operational performance. By examining these factors together, companies can identify growth opportunities and make more informed strategic decisions.
For additional information about business and financial analysis, readers can explore Investopedia, a widely used educational resource covering financial statements, business performance, valuation, and other financial concepts.
Frequently Asked Questions
What is company growth analysis?
Company growth analysis is the process of measuring and evaluating how a business changes over time. It commonly examines revenue, profit, customers, market share, cash flow, operations, and other indicators. The objective is to understand growth patterns, identify their causes, recognize risks, and support better business planning.
What are the most important company growth metrics?
Important metrics depend on the business model, but commonly include revenue growth, profit growth, customer growth, customer retention, churn, average revenue per customer, market share, cash flow, and operating efficiency. Using several metrics together provides more context than relying on revenue growth alone.
How often should a company conduct growth analysis?
The appropriate frequency depends on the company and its reporting systems. Many businesses monitor important metrics monthly or quarterly and conduct deeper strategic reviews annually. Fast-changing businesses may require more frequent monitoring, while long-term trends can be evaluated over several years.
Can a company grow revenue but still perform poorly?
Yes. Revenue can increase while profitability, cash flow, retention, or operating efficiency deteriorates. For example, a company may spend heavily to acquire customers while generating relatively little profit from them. This is why company growth analysis should examine financial and operational indicators together.
What is the difference between growth analysis and financial analysis?
Financial analysis focuses primarily on financial performance and financial position, including revenue, expenses, profitability, assets, liabilities, and cash flow. Company growth analysis is broader and can include financial results as well as customers, market share, products, employees, operations, and expansion.
Conclusion
Company Growth Analysis provides a structured way to understand how and why a business is changing over time. Rather than looking only at revenue, a complete analysis considers profitability, customers, market position, operations, cash flow, products, and external factors.
The most useful approach is to define a clear analysis period, collect reliable data, measure relevant growth metrics, identify the factors behind changes, evaluate risks, and compare results with business objectives.
The practical next step is to create a simple growth dashboard containing revenue, profit, customer growth, retention, cash flow, and other metrics relevant to your business. Review those indicators consistently and use the findings to guide future planning
